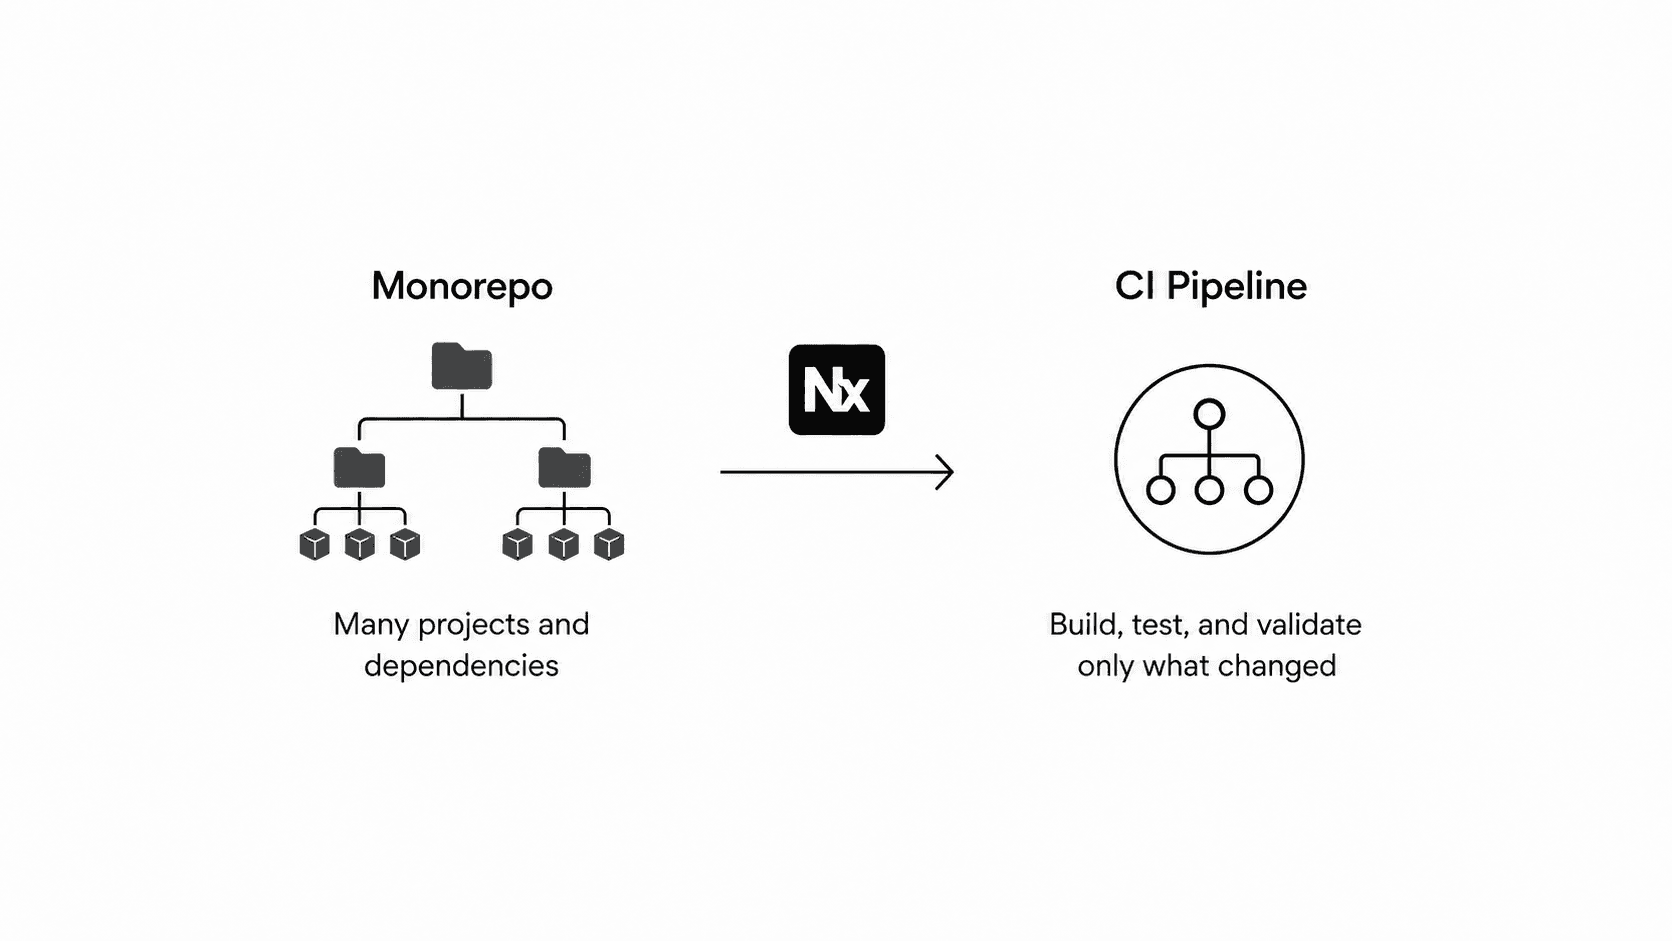
Recently, I spent some time researching monorepo scale and CI performance for a research assignment in a “research methodology” course in the university. I chose monorepo scale and CI performance as the topic, with the research title: “The Impact of Monorepo Scale and Build Optimization Techniques on Build Execution Time and Continuous Integration Pipeline Performance”.
I already work with monorepos in real projects, so I wanted to understand what happens when the repository grows and which optimizations actually have evidence behind them since large monorepos can contain many applications, packages, dependencies, build targets, tests, etc… And as these increase, CI has more work to understand and execute after every change, which can lead to longer pipelines, more infrastructure usage, and slower feedback for developers.
What I found interesting was how different the problems can be. CI might execute projects that were never affected by the change, calculate the same result again, run independent tasks sequentially, spend most of its time executing tests, or simply have jobs waiting because the available infrastructure is already busy.
Different optimizations help with different parts of this, so I wanted to go through some of them with real examples from BMW, Uber, SAP HANA, Kubernetes, and Nx!
Monorepo scale and CI workload
BMW gives a good example of CI at a much larger scale. Their automotive software monorepo contains around 70 million lines of code across multiple programming languages. Around 6,500 developers trigger approximately 10000 CI pipeline runs every day, resulting in around 28 million test executions, with peak resource consumption reaching 37000 vCPUs running concurrently! The screenshot below from the study summarizes this scale and also explains why BMW already relies on changed file detection and Bazel instead of rebuilding and testing everything.
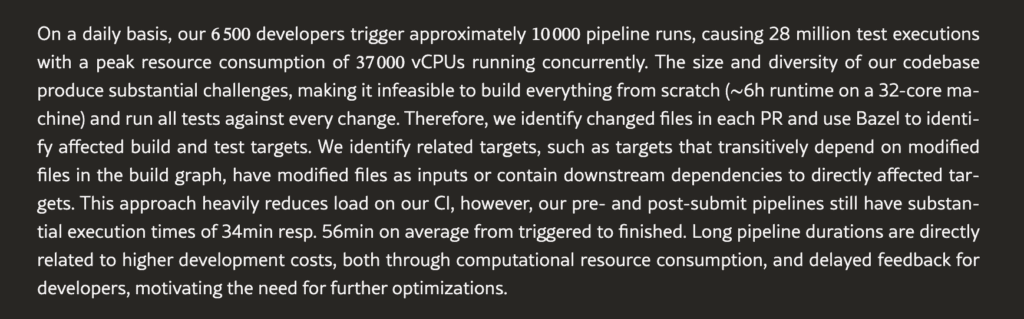
Building the complete repository from scratch takes around six hours on a 32 core machine. BMW already identifies changed files and uses Bazel to determine affected build and test targets, but the study still reports average pipeline durations of around 34 minutes for pre submit pipelines and 56 minutes for post submit pipelines!
Source: Practical Pipeline Aware Regression Test Optimization for Continuous Integration (a research paper)
BTW, of course these numbers are much larger than what most projects will ever deal with, but the same problems can start much earlier. More projects create more dependencies, and the dependency structure affects how much work CI needs to perform after each change.
Dependency graphs and affected scope
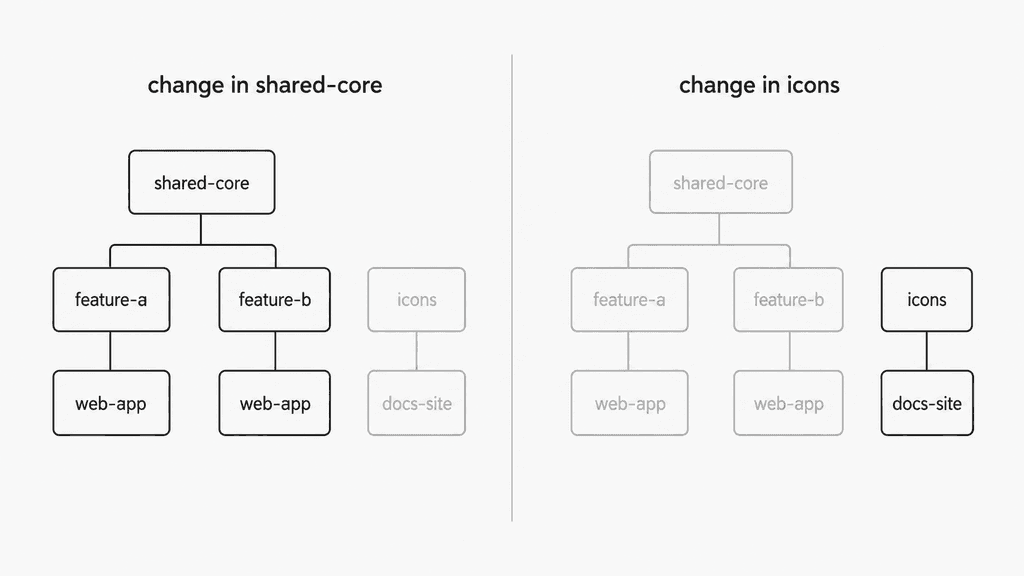
One of the parts I find most important is the dependency graph. The simplified example below shows how a shared project can be used by several other projects, while another project such as icons can have a much smaller dependency scope:
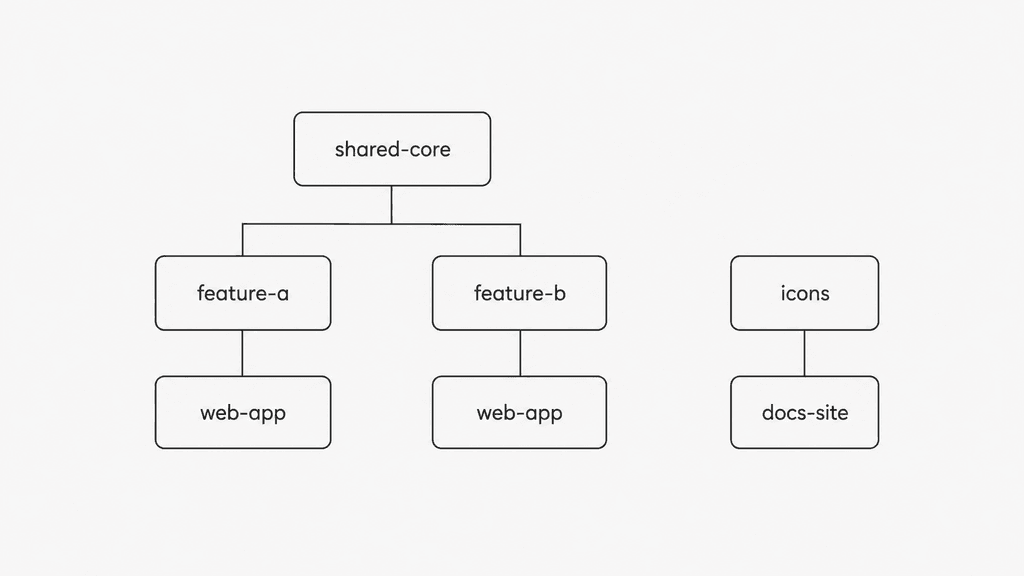
A change inside icons may require validating icons and docs-site. A change inside shared-core can require validating shared-core, both features, and web-app because all of them depend on it.
This also shows why the number of changed lines alone does not determine how much CI work is needed. A small change in a widely shared project can trigger more validation than a larger change in an isolated one because its position in the dependency graph determines how far the change can spread.
This is why dependency information becomes very important in a monorepo with many projects. CI needs to understand which projects were directly changed and which other projects depend on them.
The comparison below simply shows the difference: changing shared-core affects a much larger part of the graph, while changing icons only affects its smaller downstream branch.
Affected project detection using Nx
Nx handles this through its project graph and affected commands (check: https://nx.dev/docs/features/ci-features/affected). E.g.,:
nx affected -t lint test buildNx uses git to determine which files changed, maps those files to projects, then uses the project graph to find projects that depend on the modified ones. It runs the requested tasks only on that affected subset. In CI, the correct base and head commits also need to be configured so Nx compares the intended range of changes.
This can remove a lot of unnecessary work. If a change affects three projects out of fifty, there is usually little reason to rebuild and test the other forty seven.
However, the affected set can still become very large when a shared project changes! And Nx mentions this case directly in its documentation:
If you’re modifying a project that is used by a large portion of your monorepo projects, you might end up running tasks for almost all the projects in the workspace.
Those downstream projects really can be affected by the change, so affected detection cannot remove them safely. Nx recommends combining affected tasks with remote caching and distributed task execution, which can reduce the remaining work even when the affected set itself is large.
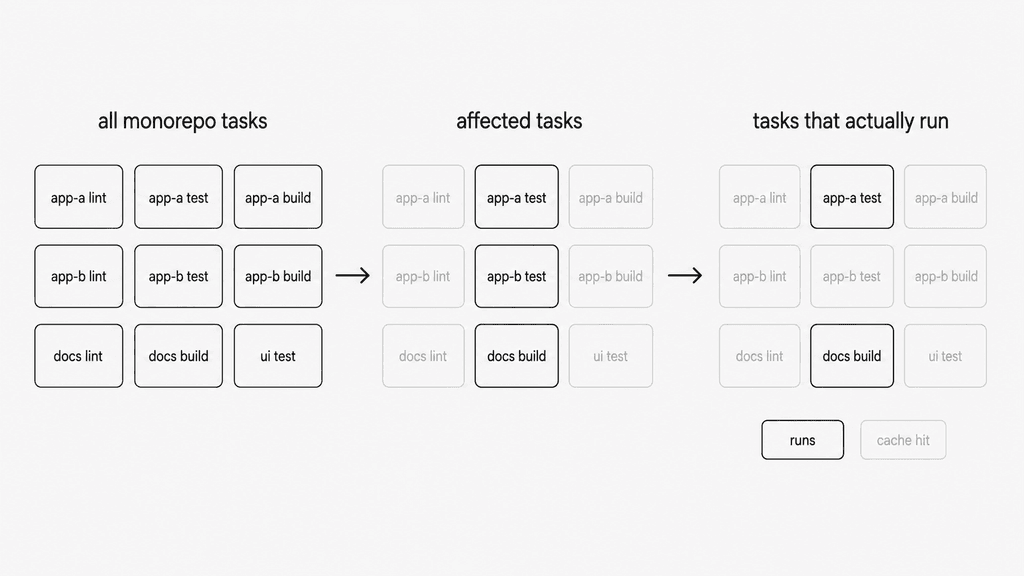
Affected calculations reduce the set of projects that need validation, which also reduces the resulting task graph in many cases and caching then can reduce repeated work inside that remaining graph.
Task caching and repeated computation
After CI knows which projects are affected, some tasks may already have been executed before with exactly the same inputs and Nx supports task caching for this (Check: https://nx.dev/docs/getting-started/tutorials/caching). A simple configuration can look like (inside nx.json):
{
  "targetDefaults": {
    "build": { "cache": true },
    "test": { "cache": true },
    "lint": { "cache": true }
  }
}When a cacheable task executes, Nx stores its terminal output and declared output files together with the hash that identifies the computation. When the same computation is requested again, Nx can restore those results instead of executing the task another time.
If the hash matches a previous run, Nx skips execution and replays the cached result. If not, Nx runs the task and stores the result for next time.
– https://nx.dev/docs/getting-started/tutorials/caching#how-caching-works
Nx also mentions that cacheable operations should be free from external side effects because the same inputs need to produce the same outputs (Check: https://nx.dev/docs/features/cache-task-results#define-cacheable-tasks).
Remote caching makes this much more useful in CI. Local caching avoids repeating work on the same machine, while remote caching allows developer machines and CI jobs to share task results. A task executed during one CI run can therefore be reused by another CI run or even by a developer machine when the inputs match. (Check: https://nx.dev/docs/features/ci-features/remote-cache)
And Nx describes the combination as:
Remote caching complements affected tasks. Affected calculations remove projects that don’t need a task, while caching avoids rerunning matching tasks in the remaining graph.
– https://nx.dev/docs/features/ci-features/remote-cache#why-use-remote-caching
Therefore, affected detection and caching reduce work at two different stages. Affected detection removes tasks that do not need to run for the change, then caching can remove matching computations from the remaining tasks. In the image below, it shows the flow from the initial task graph to the tasks that actually need to execute:
Parallel and distributed task execution using Nx
Some tasks cannot be removed through affected detection and don’t have a valid cache result. These tasks actually need to execute.
Independent tasks can usually run at the same time, E.g.,:
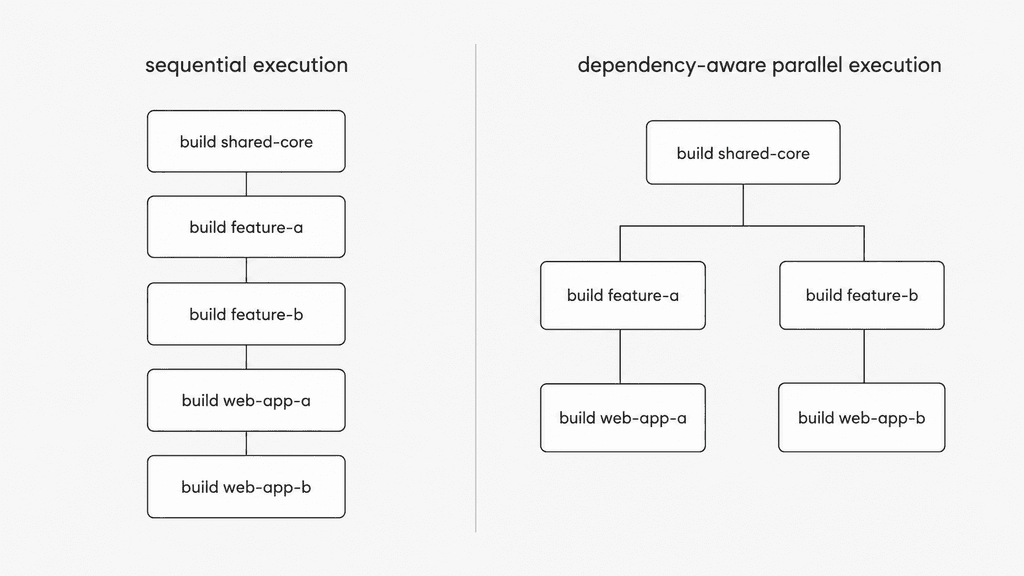
nx affected -t build --parallel=4Nx can run ready tasks in parallel while preserving dependencies in the task graph. If one project needs another project to finish first, Nx respects that relationship while unrelated tasks continue running concurrently.
A single CI machine eventually reaches its CPU and memory limits. Nx can also distribute tasks across multiple machines, while Nx Agents dynamically assign ready tasks from the task graph to available agents (Check: https://nx.dev/docs/concepts/ci-concepts/parallelization-distribution).
The figure in the image below shows the difference between executing every build sequentially and dependency aware parallel execution, where independent branches can start together once their shared dependency has finished.
BTW, more parallelism can increase concurrent CPU and memory usage, so the useful amount depends on the workload, available resources, and other factors. It becomes especially important in very large CI environments.
CI resource utilization and allocation
SAP HANA gives a good example of this:
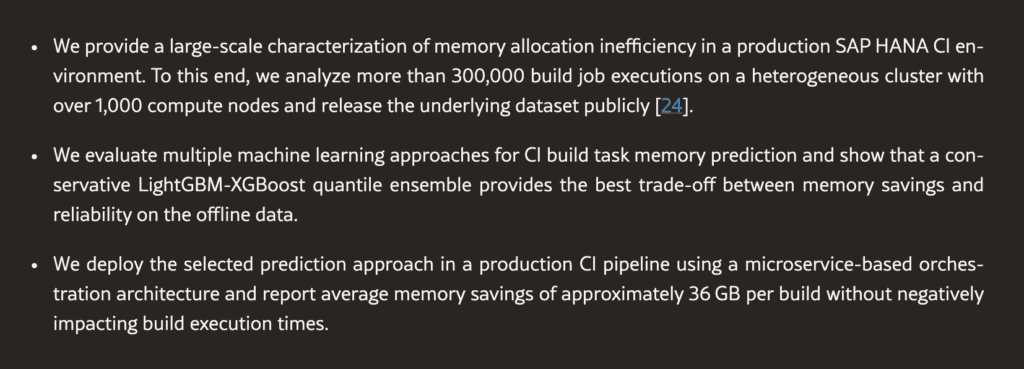
A 2026 study analyzed more than 300,000 historical build executions from a production CI environment with more than 1000 compute nodes. SAP HANA itself contains more than 40 million lines of code, around 350 components, and approximately 800 repository commits per day!
The researchers found that more than 60% of allocated system memory remained unused on average. More specifically, the median unused allocation was 60.9% across successful jobs! They developed a memory prediction approach and reported average savings of approximately 36 GB per build, with under allocation below 0.3%, without negatively affecting build execution time.
Source: Intelligent Resource Prediction for SAP HANA Continuous Integration Build Workloads (a research paper)
This screenshot from the study summarizes the scale of the analyzed CI environment, the prediction approach, and the reported memory savings:
Running many tasks in parallel can reduce elapsed time (the total time from start to finish) while increasing resource pressure. At enough scale, using the available resources efficiently becomes another part of CI optimization.
Regression testing and CI execution cost
The BMW example becomes even more interesting when looking specifically at tests (reference was mentioned above, it’s a research paper: https://arxiv.org/html/2501.11550).
Their CI environment daily executes around 28 million test executions, and the study reports that 98% of test executions in the pre submit pipelines pass. BMW separates its pipelines so that fast and deterministic tests run before merge, while long running and flaky tests can run after merge.
The researchers developed a pipeline aware regression test optimization approach using reinforcement learning. In their evaluation, the first failing test in the pre submit pipeline was scheduled within the first 16% of tests. For the post submit pipeline, the approach selected 87% of developer relevant tests within half of the current test execution time, and detected 99.78% of relevant test transitions within five CI cycles.
This is much more advanced than what most projects need, but the idea behind it is useful much earlier. When tests dominate pipeline duration, it becomes worth looking at regression test selection, test splitting, test prioritization, flaky tests, and which validations actually need to block every pull request.
- Regression test selection: Running a subset of regression tests which are considered relevant to a change instead of executing the complete test suite.
- Test splitting: Dividing the test suite into smaller groups that can execute independently.
- Test prioritization: Running higher risk or more likely to fail tests earlier.
- Flaky tests: Detecting and fixing tests that produce inconsistent results without a corresponding code change.
A fast unit test and a long hardware simulation do not necessarily need to live in the same stage of the development workflow.
CI scheduling and queue time
At large scale, many changes may be competing for the same infra / CI capacity at the same time.
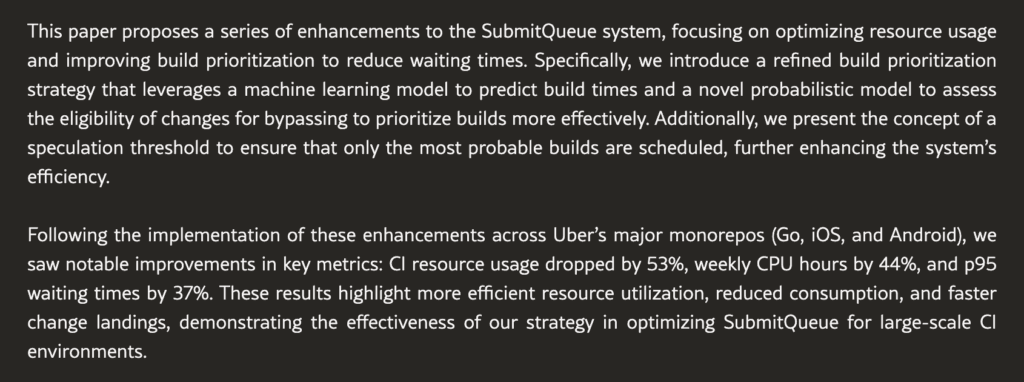
Uber has an interesting example with SubmitQueue, which speculatively executes builds before changes are landed. Their work focused on improving build prioritization and reducing unnecessary speculative work using build time prediction and a probabilistic scheduling model.
After deploying these changes across Uber’s Go, iOS, and Android monorepos, the authors reported approximately 53% lower CI resource usage, 44% lower weekly CPU hours, and 37% lower P95 waiting time!
Source: CI at Scale: Lean, Green, and Fast (a research paper)
This shows another type of CI optimization. At enough scale, deciding which build should execute and when can make a significant difference even when the individual build itself has not changed.
Git operations at monorepo scale
Uber also provides an example where the cost appears before the application build even starts. Their automation systems repeatedly clone, fetch, synchronize, and operate on very large monorepos. The GitFarm paper describes cold starts of up to 15 minutes caused by initial monorepo clones on client hosts.
Uber built GitFarm (Uber’s Git operations as a Service) as a stateful Git service backed by pre warmed repositories. Instead of requiring each client to maintain and initialize its own checkout, git operations execute remotely inside isolated environments. This allows GitFarm to provide a ready-to-use repository checkout in less than one second:
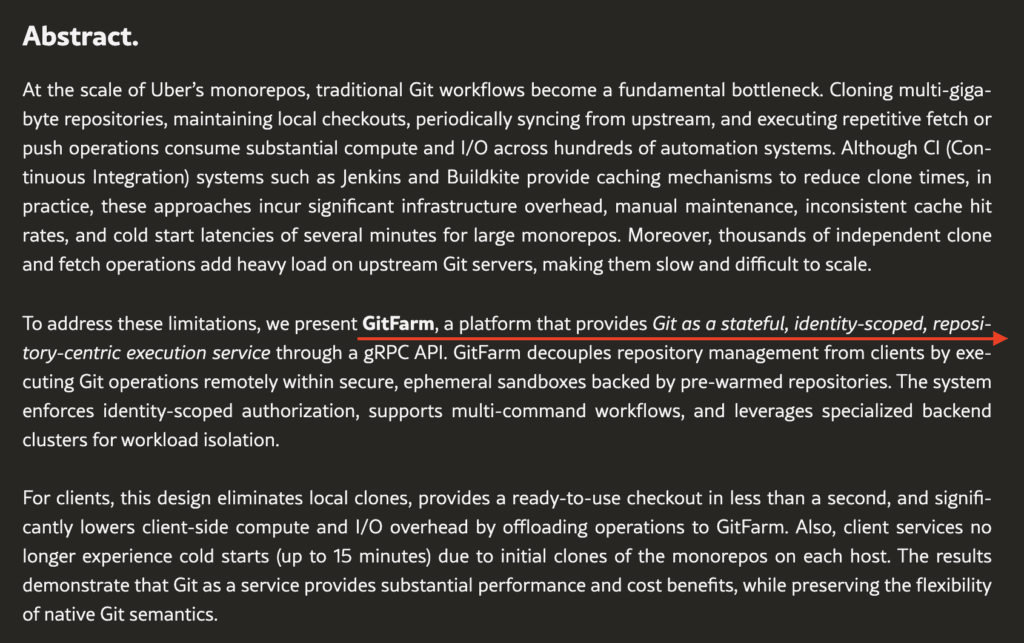
The production results also show the effect on client initialization, reducing it from up to 15 minutes to less than one minute!:

Most projects will probably never reach a scale where Git operations need an architecture like this. I still find the example useful because it shows how performance problems move as a repository and its automation grow.
A build system might be the main issue today, then testing, queueing, resource allocation, or even repository initialization can become more important later.
Build system performance and tradeoffs
The build system has a direct effect on what CI can cache, parallelize, and execute incrementally. More advanced build systems can improve these areas, but they also introduce their own setup and maintenance requirements.
A 2025 study examined Kubernetes during its migration from Bazel to Go Build. The researchers found that Bazel completed full builds in 23.06% to 38.66% less time than Go Build. At higher parallelism settings, Bazel completed incremental builds in up to 75.19% less time.
At the same time, Bazel used considerably more memory and produced higher CPU load at some parallelism levels. The authors also estimated that moving away from Bazel could increase CI build costs by up to 76% in the studied scenario. What makes this case interesting is that Kubernetes still moved away from Bazel. Build speed was only one part of the decision.
There is another study (from ICSE 2024) looked at 542 open source projects that had adopted Bazel. 61 projects, or 11.2%, later abandoned it, after a median of 638 days. The reasons included technical difficulties, integration limitations, team coordination and onboarding problems, and changes in the surrounding ecosystem.
For me, the useful info is that build system choice depends on the project. So, a more advanced system can save a lot of CI time in a large repository, while a simpler system can be easier to maintain when those optimizations are not worth the additional complexity.
How CI optimizations work together
After going through these examples, I think the easiest way to understand monorepo CI is as several layers of work that affect each other. CI first needs to know what a change can affect, which is where affected project detection reduces the task graph before execution. Caching can then remove tasks whose results are still valid, while parallelism and distribution help execute the remaining work faster.
Other problems become more important depending on where the pipeline spends its time. When tests take most of the pipeline duration, test selection and prioritization can have a larger effect than adding more machines. When builds spend noticeable time waiting for available workers, scheduling becomes more important, and once the infrastructure itself becomes large, resource allocation can reduce wasted CPU and memory.
BTW, Nx follows a similar model in its Building Blocks of Fast CI documentation (Check it: https://nx.dev/docs/concepts/ci-concepts/building-blocks-fast-ci) by combining affected tasks, caching, parallelism, and distribution as parts of the same CI strategy.
- “Affected calculations reduce the task graph before execution. Caching removes repeated work from the remaining graph.”
- “Nx runs independent tasks in parallel while respecting task pipeline dependencies. Set a workspace-wide concurrency limit with
parallelinnx.json, or use a command-line option such asnx affected -t test --parallel=4for one run.”– https://nx.dev/docs/concepts/ci-concepts/building-blocks-fast-ci
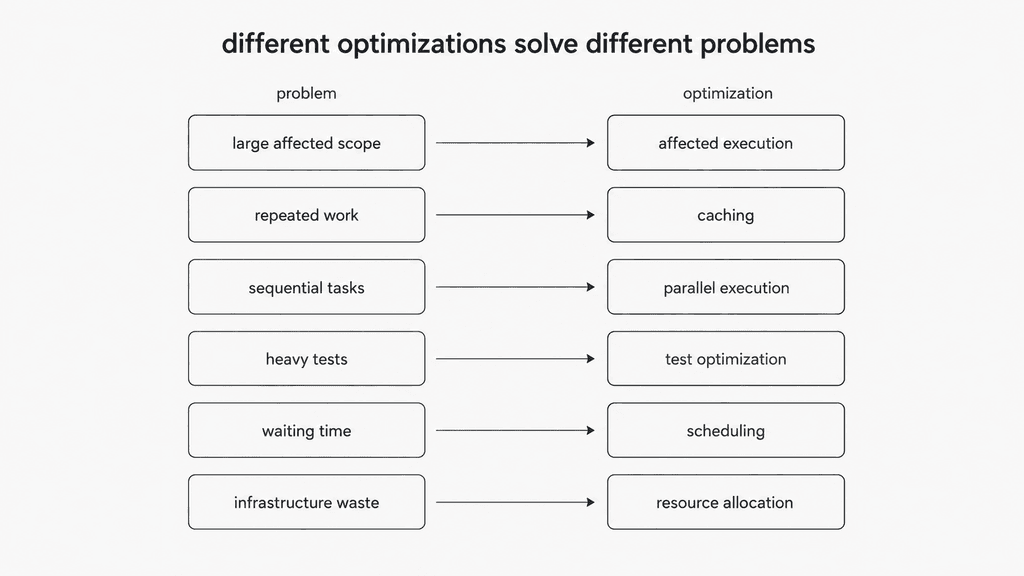
This figure summarizes the main relationship between these problems and optimizations. Each optimization targets a different CI problem, so before applying them I would first measure where the pipeline is spending its time and resources, including the total duration, queue time, task and test duration, cache hit rate (the percentage of cache lookups that reuse a valid result), and CPU/memory utilization… For example:
- If CI is running many unrelated tasks -> affected detection should be improved first.
- If a widely shared package legitimately affects a large part of the repo -> affected detection cannot reduce much more, so caching / parallelism / distribution here become more useful.
- If many tasks repeat the same computation -> caching matters more.
- If independent tasks are running sequentially -> parallelism or distribution can help.
- If jobs spend a lot of time waiting for available runners -> scheduling or additional infrastructure may be more useful!
The CI optimizations I would prioritize first ;D
For most monorepos, I would start by making sure the project dependency graph is accurate because affected detection depends on knowing which projects changed and which other projects depend on them. Once this information is reliable, CI can reduce the amount of work created by each change instead of treating the whole repository as affected.
In an Nx workspace, would start with:
nx affected -t lint test buildAfter affected tasks, I would look at caching because build, test, and lint tasks are often deterministic enough to reuse when their inputs have not changed. Remote caching makes this more useful in CI because results can be shared between runs and machines instead of being calculated again each time.
For tasks that still need to run, I would then look at parallelism. Nx already runs independent ready tasks in parallel, so I would check whether the concurrency level makes good use of the available CPU and memory. When one CI machine reaches its practical limits, distributing those tasks across several workers can reduce the overall pipeline duration.
Tests deserve separate attention once they start taking a large part of that duration. At that point I would look at which tests can actually be affected by a change, how the suite is split, whether important tests can run earlier, and which validations really need to block a pull request.
Scheduling and resource prediction would come later for me because they become more useful once the CI environment is large enough for waiting time and infrastructure usage to become significant. At that scale, improving how jobs are scheduled or how much CPU and memory they receive can matter as much as improving the individual build itself.
Nx uses the same nx affected command in its CI setup documentation and builds on it with caching, parallelism, and other CI features as the workspace grows.
Researching this topic made the relationship between monorepo scale and CI performance much clearer for me. Repository size matters, but the dependency graph can have an even larger effect because it determines how far a change spreads and how much validation CI needs to perform!
I like monorepos and the development workflow they provide. What I would pay more attention to now is how CI behaves as the repository grows, and I guess this is also something I will keep improving in this article as I get more experience with larger monorepos and CI setups 😀